
Dashboard
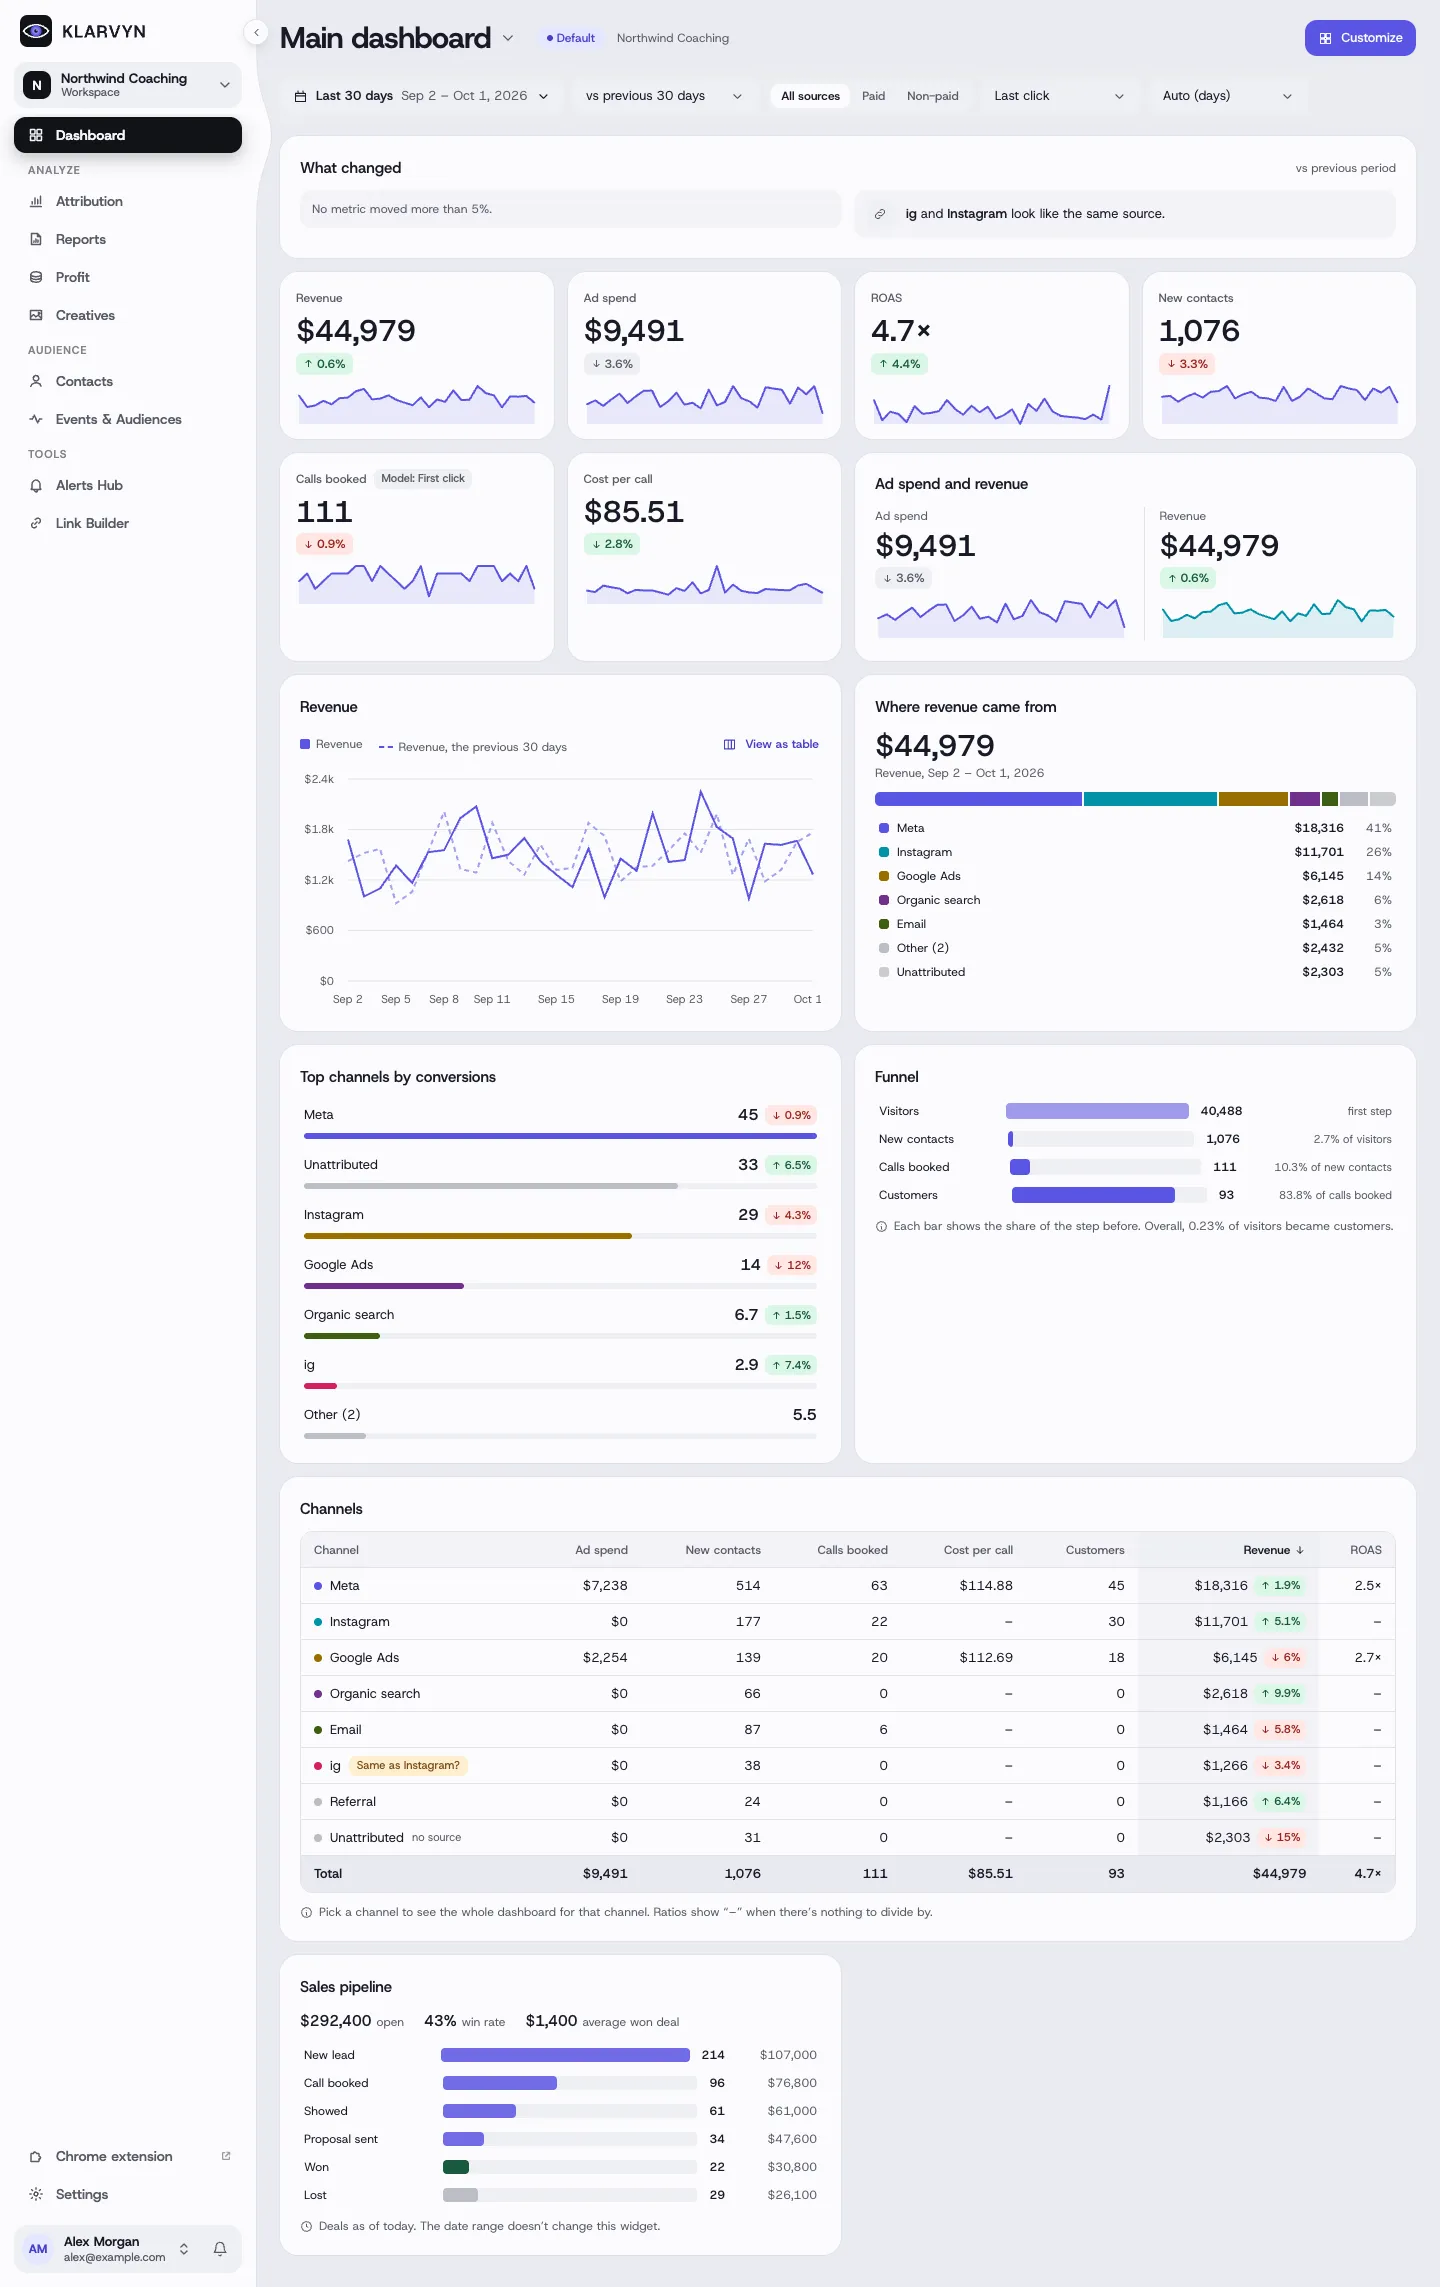
The Dashboard is the first page you see: revenue, ad spend, ROAS, new contacts and calls at a glance, with the charts and tables that explain them.
What’s on it
Section titled “What’s on it”- What changed — the metrics that moved most against the previous period, plus hints like “ig and Instagram look like the same source”.
- Key numbers — revenue, ad spend, ROAS, new contacts, calls booked and cost per call, each with its change and a small trend line.
- Charts — revenue over time against the previous period, where revenue came from, top channels by conversions, your funnel (visitors → contacts → calls → customers) and, with a CRM connected, your sales pipeline.
- Channels — the full table per channel: spend, contacts, calls, cost per call, customers, revenue and ROAS. Click a channel to see the whole dashboard for just that channel.
The controls
Section titled “The controls”Along the top: the date range and what to compare it with, All sources / Paid / Non-paid, the attribution model, and how charts are grouped (days, weeks, months). Every widget follows them. The address bar keeps the whole view, so a link reopens exactly what you see.
Your own dashboards
Section titled “Your own dashboards”Click Customize to add, remove, resize and reorder widgets — changes are a draft until you Save, with undo while you work. Use the dashboard menu next to the title to create more dashboards, rename, duplicate, delete, or set one as default for the workspace.
Good to know
Section titled “Good to know”- Viewers can’t customize — they see the dashboards, but editing needs a Member or Admin role.
- Ratios show “–” when there’s nothing to divide by (for example ROAS with no ad spend connected yet).
- The pipeline widget shows deals as of today — the date range doesn’t change it.