
Experiments
Experiments (under Analyze) shows the split tests running on your site, measured on Klarvyn’s own data — so you judge variations on real leads, calls and revenue, not just on clicks.
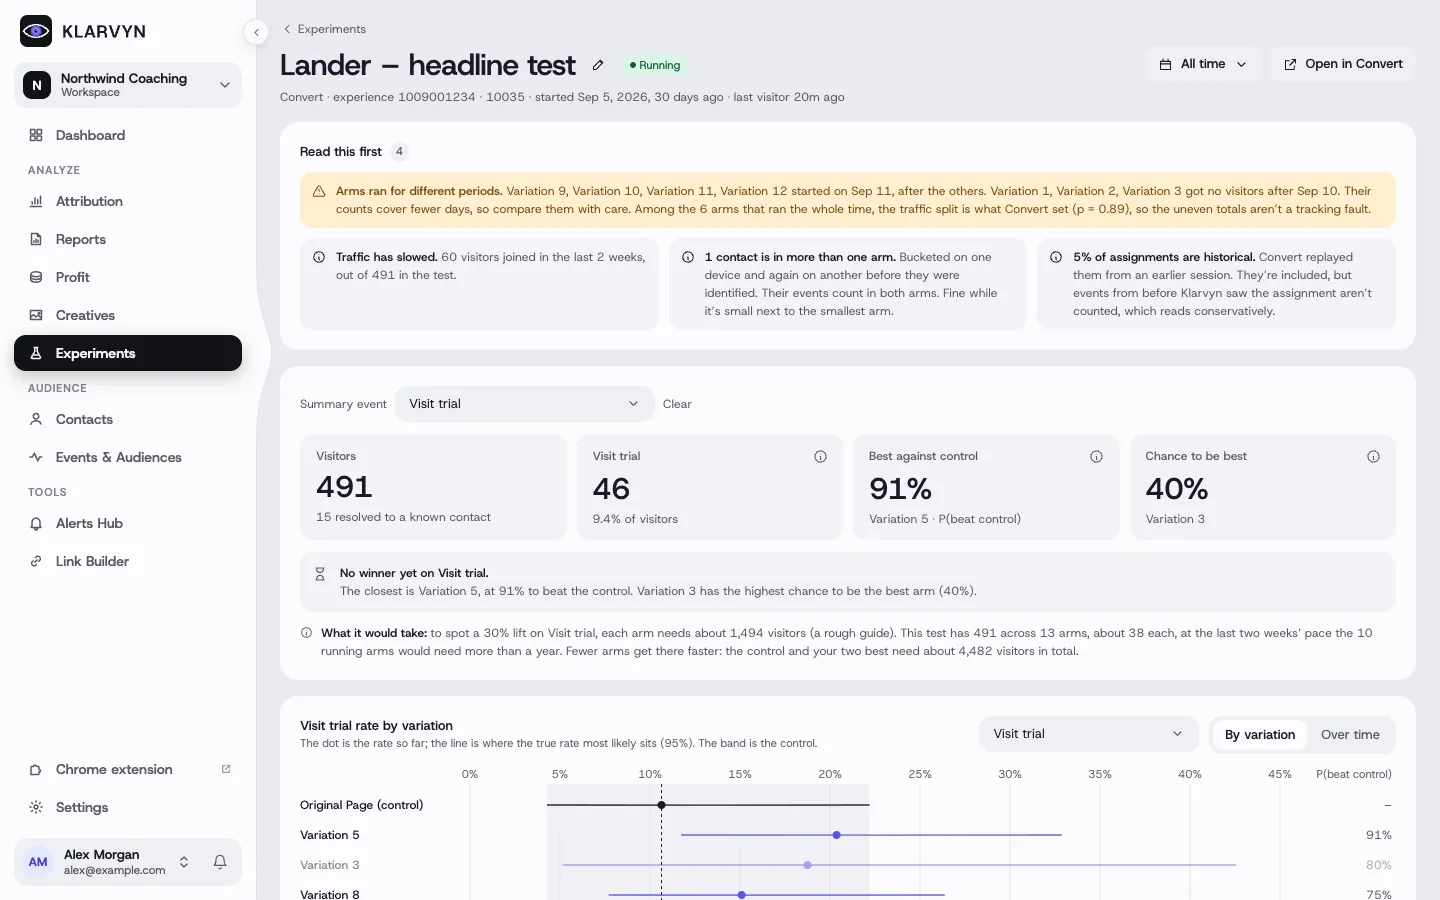
Experiments is turned on per workspace and works with the Convert Experiences integration (Settings → Integrations → Split testing).
The list
Section titled “The list”Every test with its status (running, paused, finished), how long it has run, visitors per variation and the current leader on your chosen event.
An experiment’s results
Section titled “An experiment’s results”- Read this first — anything that affects how to read the result, such as variations that started late or traffic that isn’t split as expected.
- Summary — pick the event that decides the test (for example a booked call or a purchase). Klarvyn shows each variation’s rate, how sure it is against the original, and the chance each variation is the best.
- By variation / Over time — the rate per variation with its range, and how it developed day by day.
- Table — every variation with visitors and the events they triggered. Choose Columns to add your own events or statistics, and save them as a preset. Click a number to see the contacts behind it.
Good to know
Section titled “Good to know”- The summary waits for you to pick an event — it lists the events the test’s visitors actually fired.
- Klarvyn reads the tests themselves from Convert; everything measured comes from Klarvyn’s tracking, so results connect to your contacts and revenue.
- Open in Convert jumps straight to the test to change or stop it.