
Attribution & Reports
Two pages under Analyze in the sidebar cover reporting: Attribution — the core report where ad spend meets the revenue Klarvyn actually tracked — and Reports, a shelf of deeper business reports you enable as needed.
The Attribution report
Section titled “The Attribution report”The heart of Klarvyn: every channel, campaign, ad set and ad, with the ad platforms’ spend/impressions/clicks next to Klarvyn-tracked outcomes — form submits, calls, new customers, revenue, ROAS, CAC.
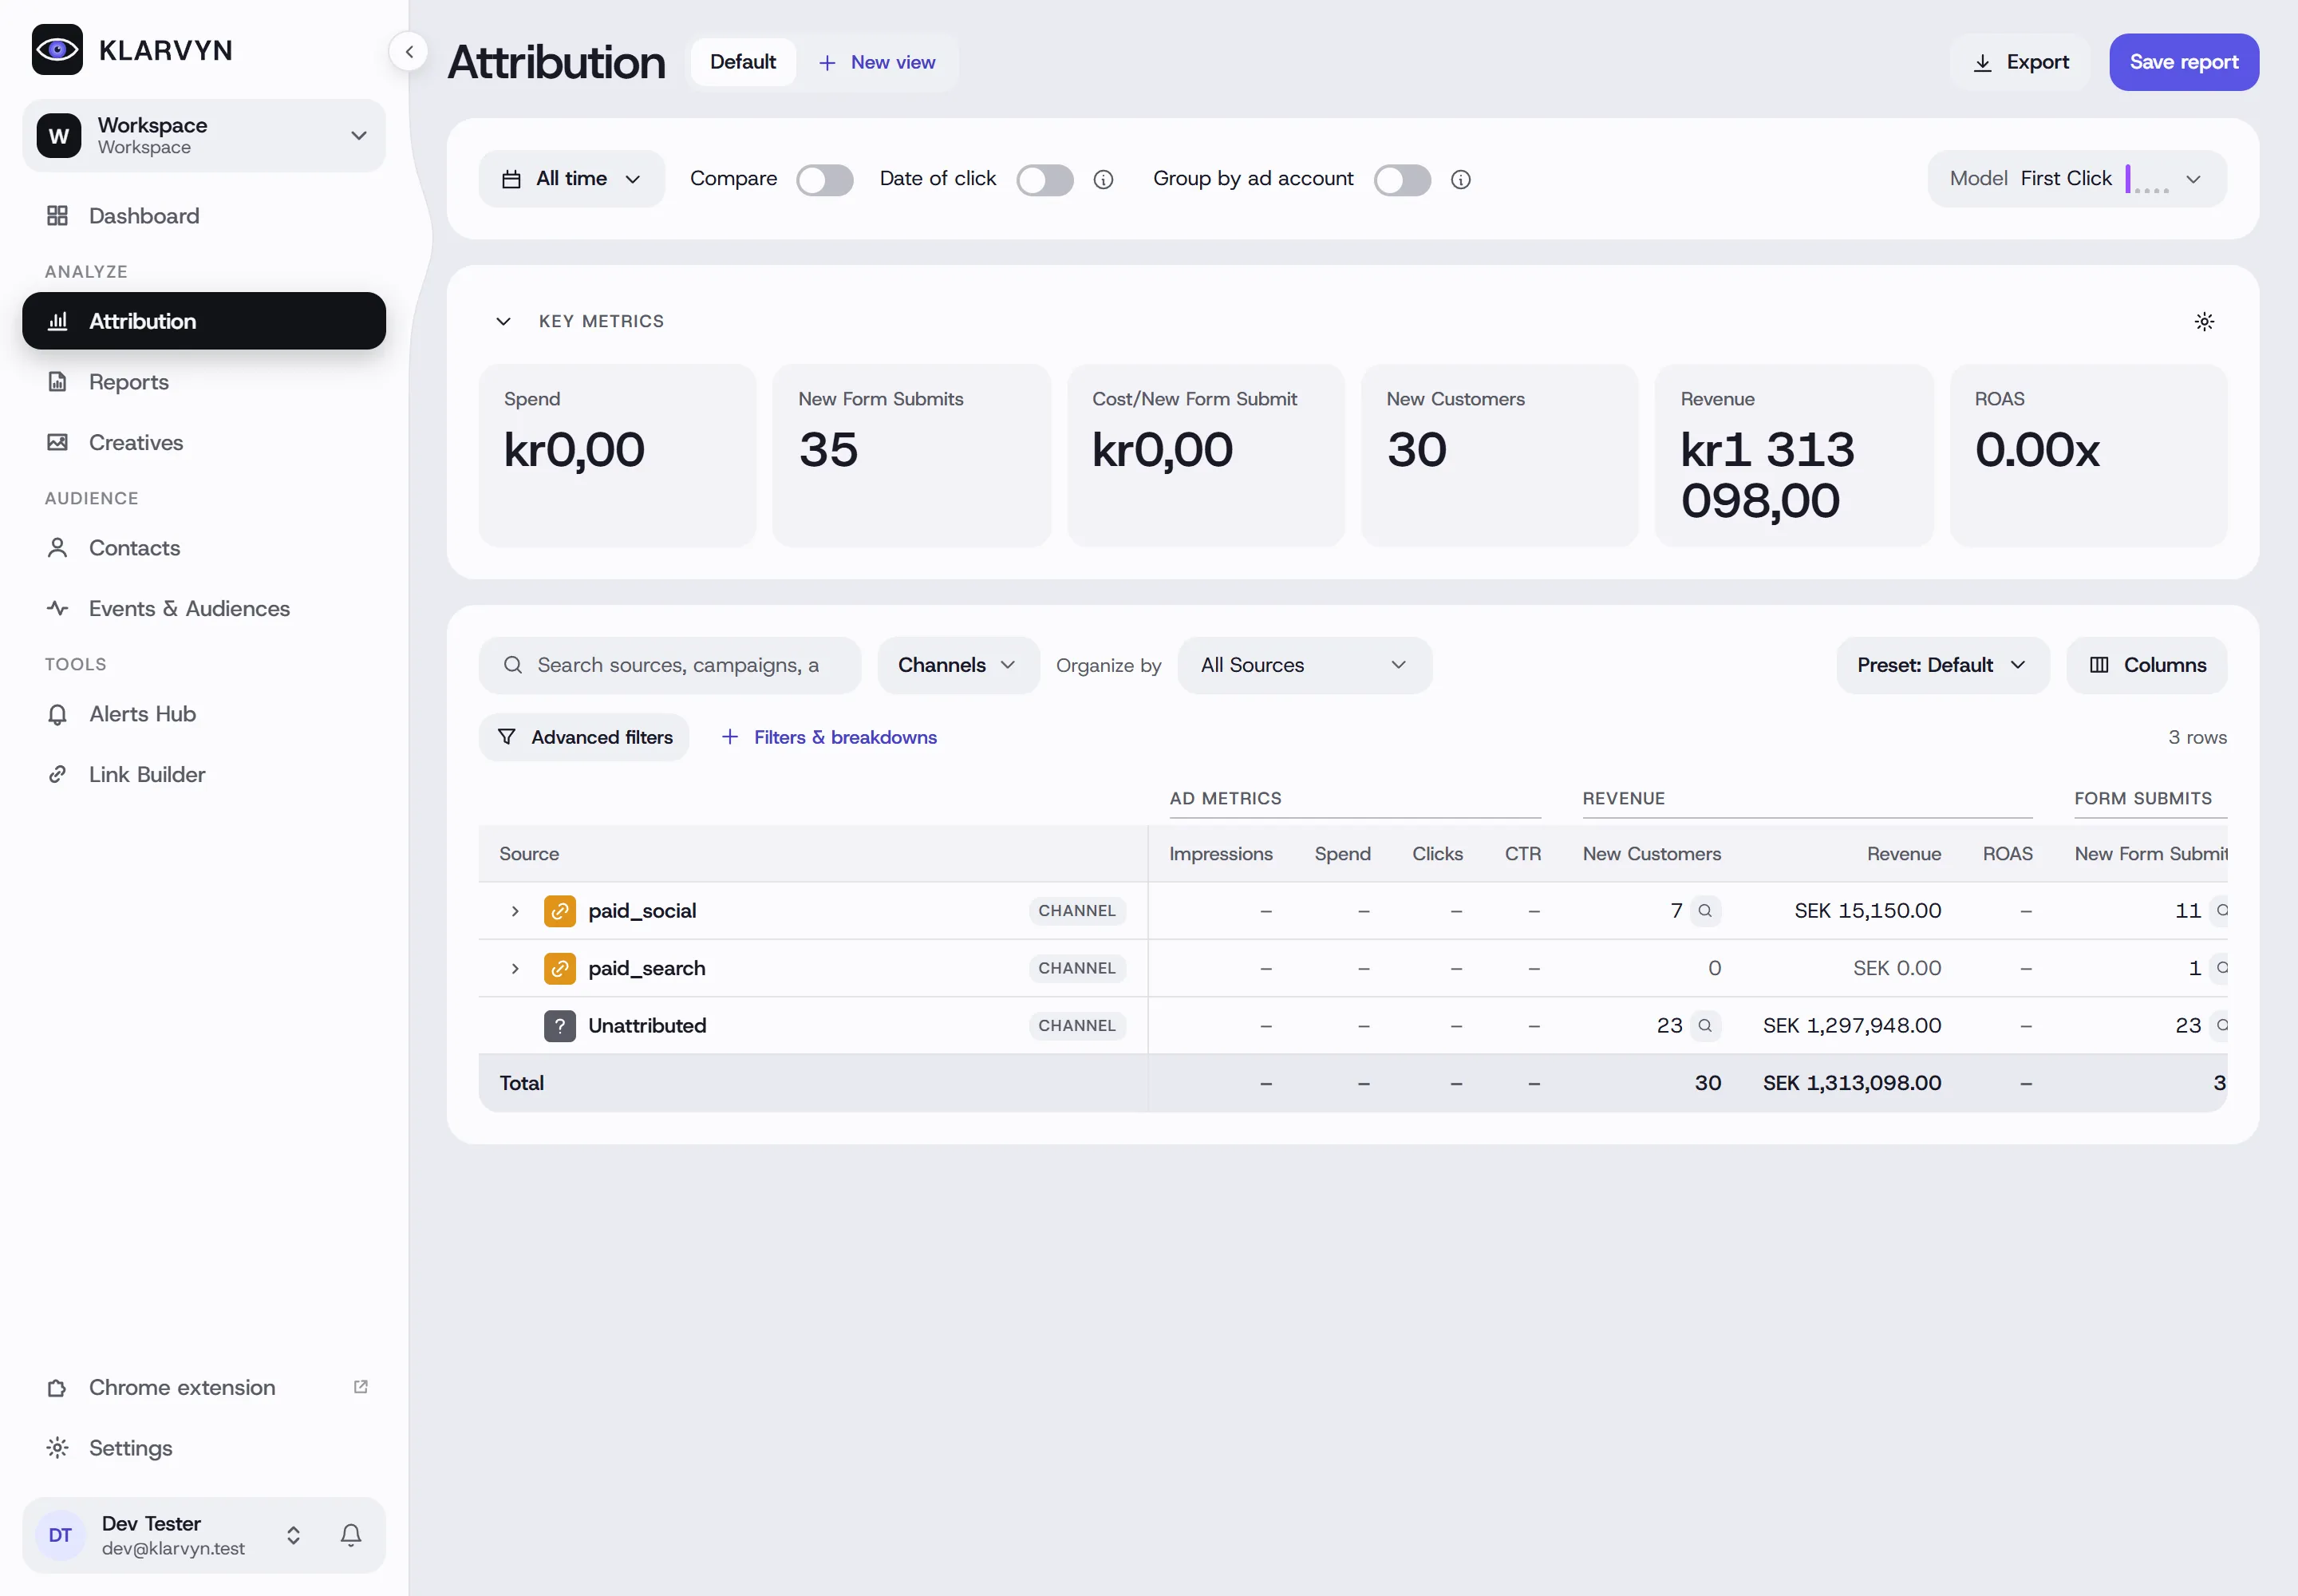
- Model, compare and Date of click — pick the attribution model, compare to a previous period, and turn on Date of click to credit revenue to the date of the click that drove it (a May click that becomes a July sale counts under May, so revenue lines up with the spend that produced it).
- Organize & drill — group paid sources by campaign → ad set → ad, non-paid by campaign/source/medium; use Filters & breakdowns to break down by platform or placement, or filter by status (active/paused). Advanced filters narrow by channel, campaign, product, tag and more.
- Custom columns & presets — choose from 40+ metrics, build your own formula columns, and save column presets (shared with the team or private).
- Click into the numbers — cells like New Customers or Calls Booked open the exact contacts behind the number.
- Views — Save report keeps the whole view (range, model, filters, columns) as a named tab next to Default; New view starts another. Export downloads any view as CSV.
The report suite
Section titled “The report suite”Enable the reports that match your business model (one click under Manage):
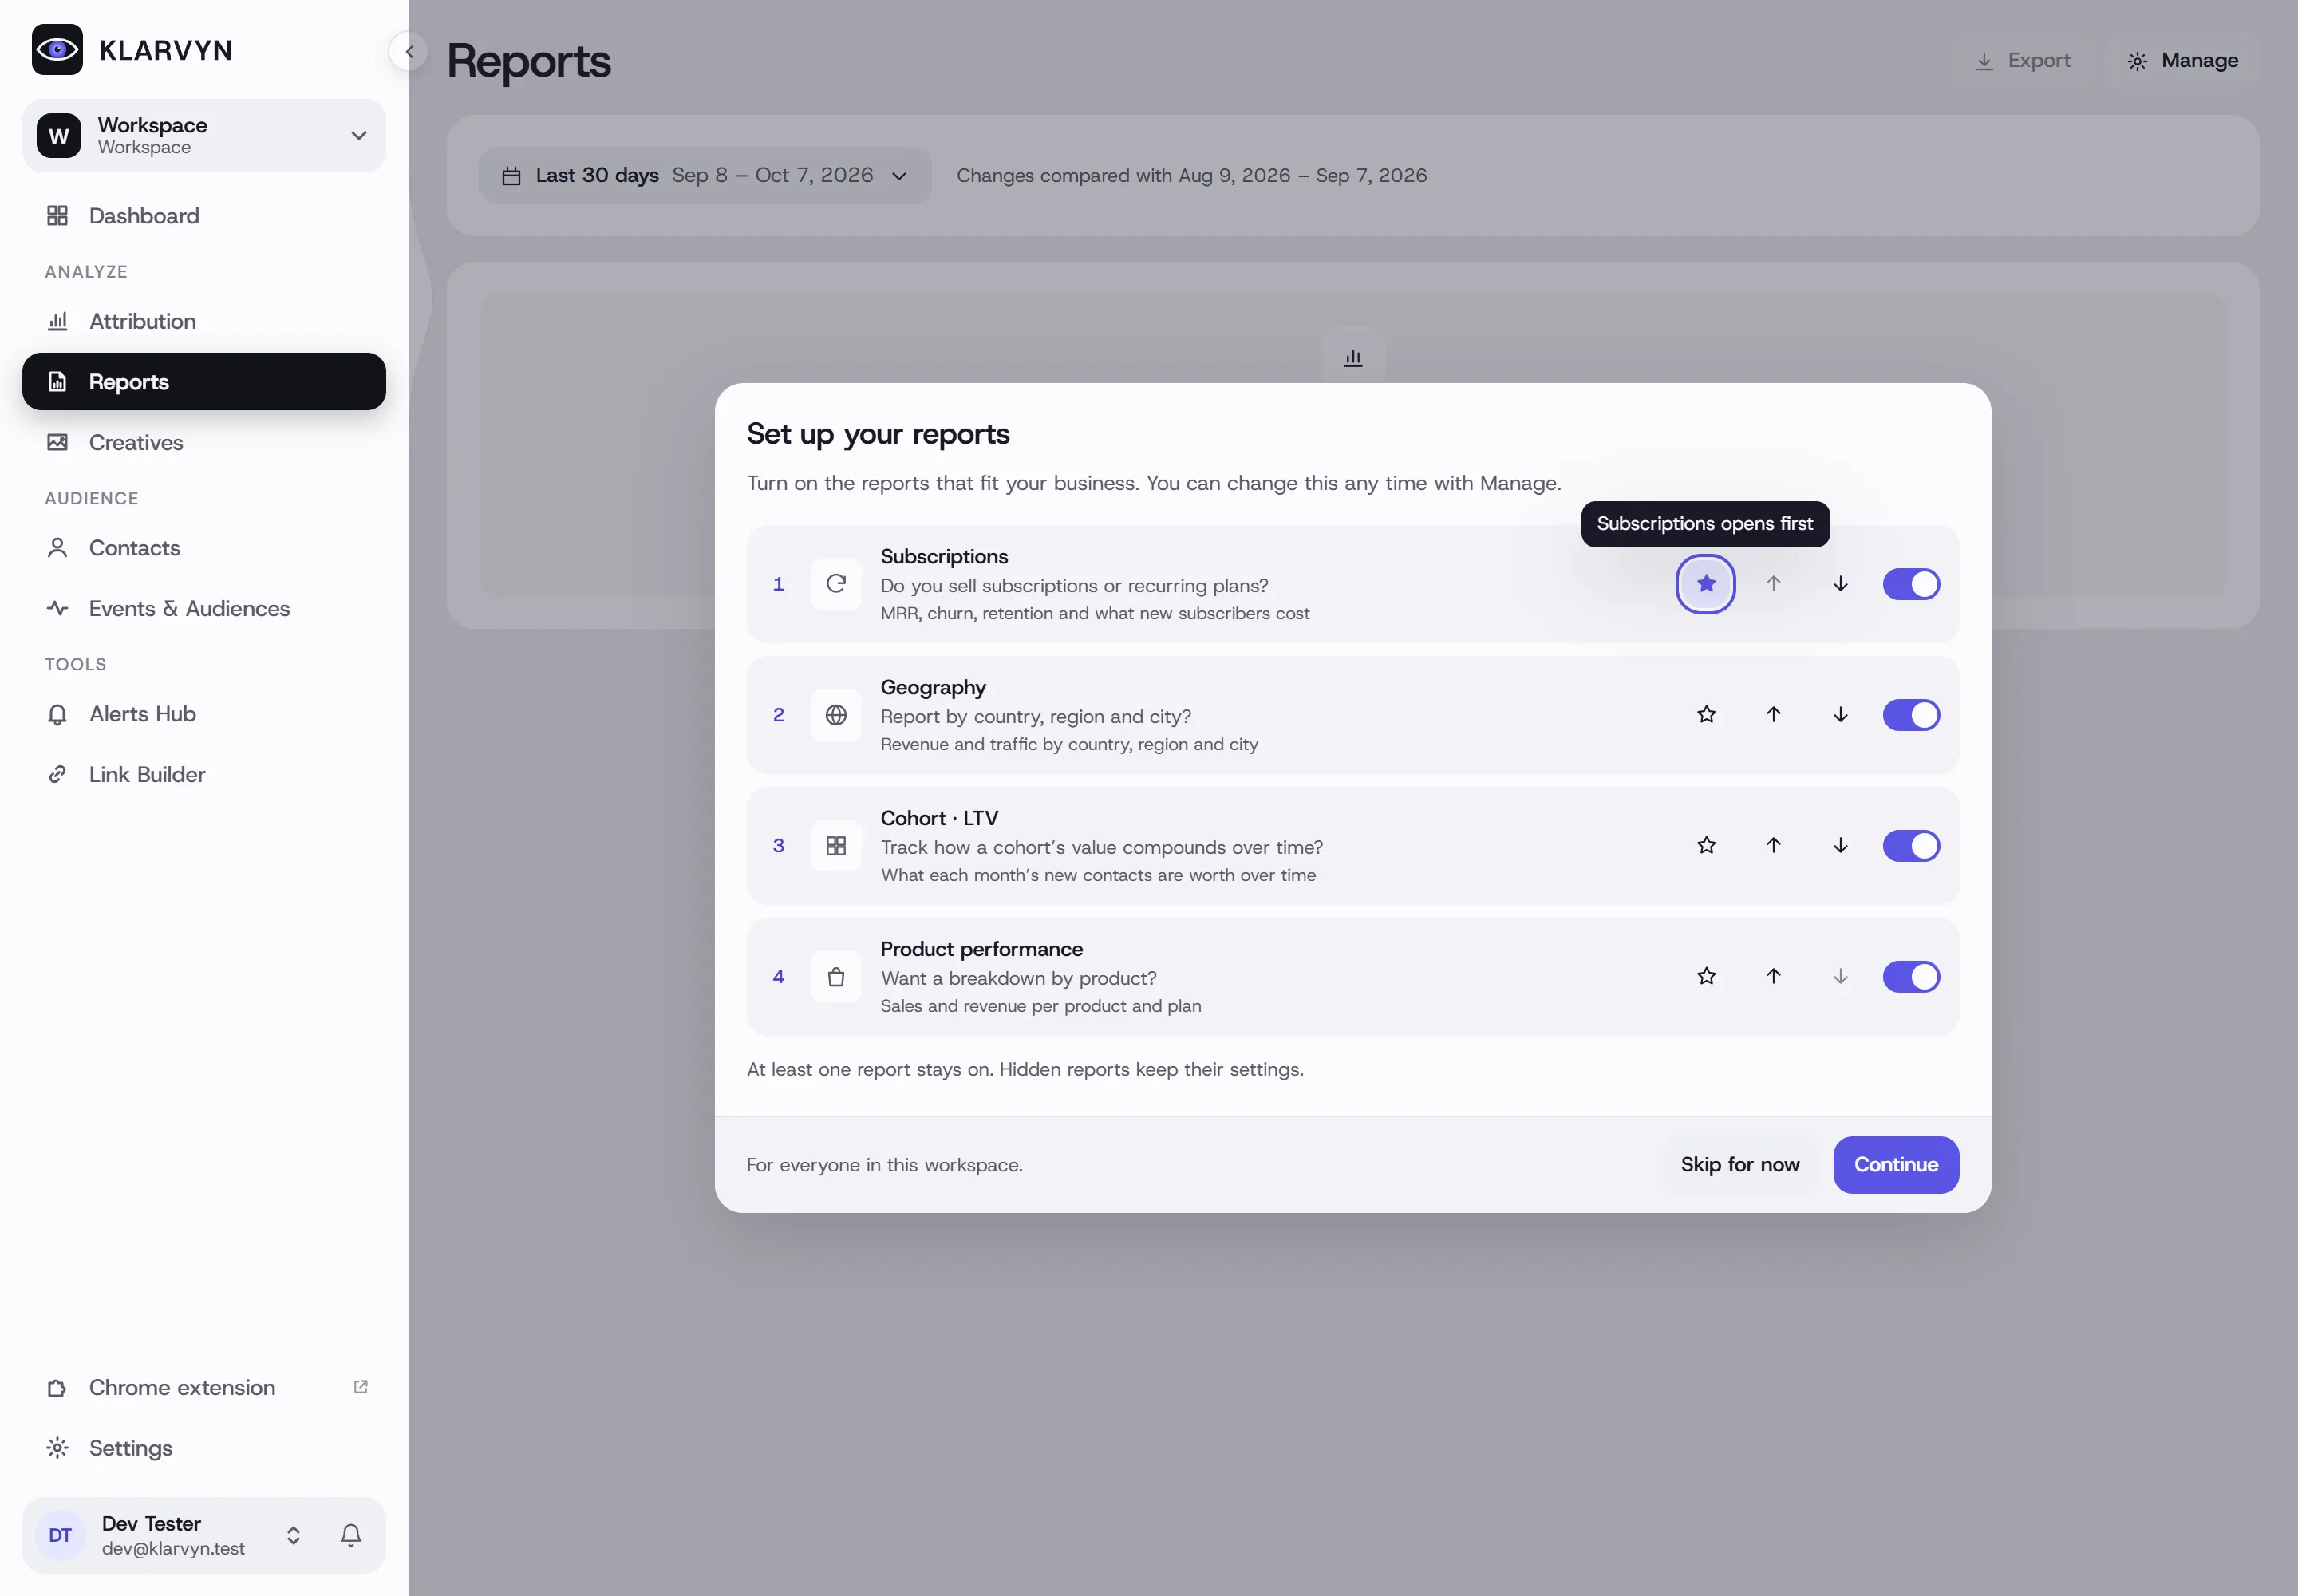
- Subscriptions — MRR, ARR, churn, ARPA, MRR movement (new business, expansion, contraction, churned) and a forward-MRR outlook. Subscription CAC is configurable for businesses where products fund the subscription funnel.
- Geography — country → region → city drill-down across traffic, contacts, calls, revenue and subscriptions.
- Cohort · LTV — how each acquisition cohort’s value compounds over time, heat-mapped against the ad spend that acquired it (100% = break-even).
- Product performance — revenue, sales, AOV and refunds per product. With Profit turned on, it also holds Edit product costs and shows gross profit and margin per product.
Good to know
Section titled “Good to know”- A channel with no ad integration shows conversions but no spend — so ROAS, CAC and cost-per columns stay empty. Connect the ad platform to complete the picture.
- Cohort “Spend” is ad spend during the acquisition period — organic cohorts show “—” and their ROI coloring isn’t meaningful.
- Scheduled report emails live in the Alerts Hub, not here — save views here, schedule sends there.